Figure
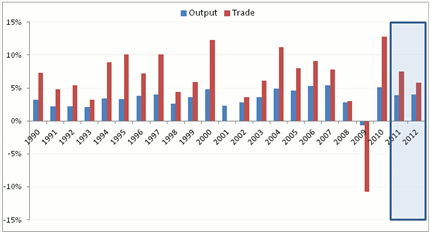
1. Recent developments and projections in world trade and output
(volumes). Source: IMF World Economic Outlook, September 2011.
The question of what can explain the much sharper fall in world trade compared to world output in the aftermath of the crisis stimulated a wealth of theoretical and empirical analysis. Accordingly, several studies investigated various aspects of the Great Trade Collapse.
An early analysis was presented in Baldwin (2009), which provided key statistics on the geographical and sectoral composition of trade flows during the collapse and an initial investigation of its causes.
Key explanations for the trade collapse now include inventory adjustment (Alessandria et al 2010), the drying up of trade finance (Amiti and Weinstein 2011, Chor and Manova forthcoming), the role of imported intermediate goods (Levchenko et al 2010) and compositional effects along the durable/non-durable goods dimension (Eaton et al 2011). Reviews of this literature can be found in Baldwin (2009) and Bussière et al (2011).
Two important stylised facts
In a recent study (Bussière et al 2011), we contribute to the debate by proposing a new measure of aggregate demand for empirical trade equations, which builds on two important stylised facts and a simple theoretical foundation.
Figure 2. Import contents of main GDP components. Source: OECD Input-Output tables and authors' calculations.
The first important empirical observation is that a naive comparison of world trade and output ignores that the components of GDP have very different import contents. The OECD Input-Output tables provide the necessary information for computing the import content of GDP components. The most recent database includes tables for all OECD countries and several non-member countries for the years 1995, 2000, and 2005.
Figure 2 plots the latest import contents for 18 selected countries (those in the empirical study in Bussière et al 2011). The striking pattern that appears in Figure 2 is that the import content of government spending is lower than that of private consumption, which is lower than that of investment and exports.
This holds on average across countries, but also for most individual countries. This import-content ranking is fairly intuitive. For instance, the fact that government spending has the lowest import content is not surprising, given that it generally includes goods or services that are not traded internationally, or for which there is a strong home bias. Similarly, the strong import content of exports can be explained by the internationalisation of production chains (see for example Hummels et al 2001 and di Giovanni and Levchenko 2009).
The second key stylised fact is that GDP components display very different dynamics during recessions, as revealed by event case analysis. Figure 3 plots the average, cumulated path of GDP components during the recessions that took place between 1985 and 2007 (left panel) and the most recent one (right panel) for the same set of countries in Figure 2. All charts show that GDP falls during recessions, but its components do not decrease by the same magnitude: investment is the most strongly affected, while government spending barely falls (in fact it rises slightly at shorter horizons, possibly due to countercyclical measures). Private consumption follows a somewhat intermediate path between these two extremes. Interestingly, real imports typically fall much more than GDP. Beyond these similarities, a key difference sets the last recession apart from previous episodes. As shown in the right panel of Figure 3, exports fell much more in 2008–09. Partly, this is due to the fact that the latest recession was truly global: if all countries’ imports fall, then by definition all countries’ exports must fall as well. However, the strong import content of exports highlighted above provides another explanation for the synchronicity of the fall in exports and imports.
How much can these facts explain the Great Trade Collapse?
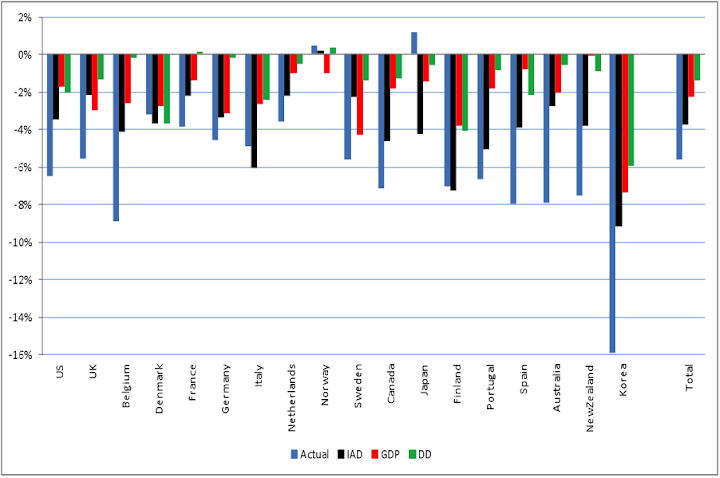
To investigate the role of import content and demand composition more systematically, we start from estimating a simple empirical trade model, widely used in the literature to analyse aggregate trade flows. We regress the quarterly growth of real imports in country c, Mc,t, on a country dummy (δc,t), contemporaneous and lagged values of quarterly growth in aggregate demand (Dc,t) and import prices (PM,c,t). The model suggests that the change in imports to a country is affected by changes in the exchange rate, the current trend in imports, and of course current aggregate demand. We measure aggregate demand in three ways: GDP, domestic expenditure, and a novel import-intensity-adjusted measure of aggregate demand we denote IADt. The latter weights the components of GDP by their import intensity, computed from OECD input-output tables.

Figure 4. Actual vs fitted values of real import growth in 2008Q4.
We use the regression results to go one step further in investigating the relationship between the composition of demand, import content, and the Great Trade Collapse, by decomposing import growth for each country in the panel and computing the individual contributions of the four components of our import-intensity demand measure (consumption, investments, exports, and government spending) to import fluctuations. The results show that, while investment and export dynamics explain most of the fall in imports, the main driver of this fall varies substantially across countries.
Our findings also have implications for the long-standing puzzle of abnormally high estimated elasticities of imports to domestic demand first documented by Houthakker and Magee (1969). We show that the high elasticities are driven by recession episodes and that our measure of demand yields elasticities that are lower in magnitude and more stable over the cycle by accounting for the import intensity of demand components.
To summarise, according to our investigation, there is no major ‘puzzle’ in the magnitude of the fall in world trade observed during the recent financial crisis. Trade fell mostly because demand crashed globally and did so particularly in its most import-intensive component – investment. Moreover, the strong relationship between exports and imports in each country, due to the increased internationalisation of production and the strong dependence of the tradable sector on imported inputs, contributed to the simultaneity and unprecedented severity of the trade collapse.

No comments:
Post a Comment